


Catching Fraud Using Statistics
How simple statistics unravelled an influential paper

As a child, I used to be fascinated by investigative characters like Sherlock Holmes, Dr. Gregory House, and our very own Byomkesh Bakshi.
These characters would always be on the lookout for the tiniest of details, or the minutest of observations that could help them solve a case/find a diagnosis.
The thing is, the adversaries of these great detectives were quite skilled as well. They left almost no evidence behind and always had a red herring up their sleeve.
People who fabricate data in the social sciences are apparently not that diligent in committing crimes, as can be seen in the case of Dan Ariely’s 2012 paper, “Signing at the beginning makes ethics salient and decreases dishonest self-reports in comparison to signing at the end”
It should be noted that Ariely was not the primary author of the paper. Although, he was the one who handled most of the data.
The Background
Dishonest reporting of taxes is a major problem in many countries across the world. People don’t want to let go of their hard-earned money easily so they often underreport their income to pay less tax. The USA is no different.
In 2012, Ariely and his co-authors suggested they had found a neat trick to encourage people to report their income honestly. It didn’t involve huge punishments or force of threat.
It was a simple shift of a question from the bottom of the form to the top.
If you have ever filled out a government form, you might be familiar with a question saying, “The information provided above is true to the best of my knowledge.” or a similar variant.
These questions display an intent of honesty. Ariely’s idea was simple. If this question is shifted to the top of the form, people behave more honestly. He, along with his colleagues, claimed to have data to back it up.
The Study
The researchers teamed up with an auto insurance company in the US. They asked people who used the company insurance to report the mileage (distance traveled) on their odometer. Basically, the participants had to report how much they were driving their cars through a form.
If you drive more, you are more likely to get into an accident so the customer’s best interest is to underreport the odometer reading. (Similar to filling out a tax form)
Participants were given two types of forms. One that had the intent of honesty at the bottom and the other that had the intent of honesty at the top.
The experiment was done on ~13,500 people with a 10% difference between the two conditions. The researchers claimed they had strong evidence that merely shifting a question can change people’s degree of honesty.
The study was a huge success and was widely reported in the news. The Obama administration recommended adopting this ‘reform’ in 2016.
The Fraud
All good things come to an end. Sadly, this study did too.
Some researchers downloaded the original data from the study in 2020 and were shocked at what they saw.
When we talk about how much people drive their cars, it is unlikely you will ever get the same answer from everyone.
Some people drive very little, some people drive a lot and most people drive a moderate amount. Right?
That would give you a bell-shaped distribution. As you can see below in the data from the UK, 2010.
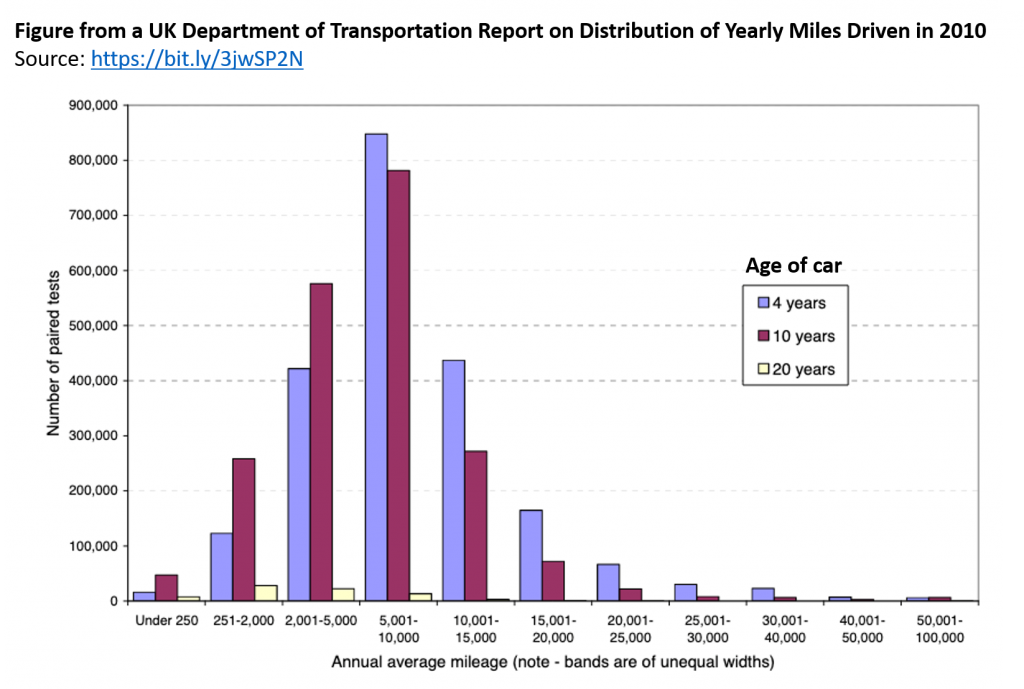
It is fair to assume that if you take a sample of 13,500, you will get a similar shape as well. It might not be exactly the same but it will be similar to this shape.
Not if you are a behavioral economist though!
This is what the data distribution looked like in the 2012 paper.
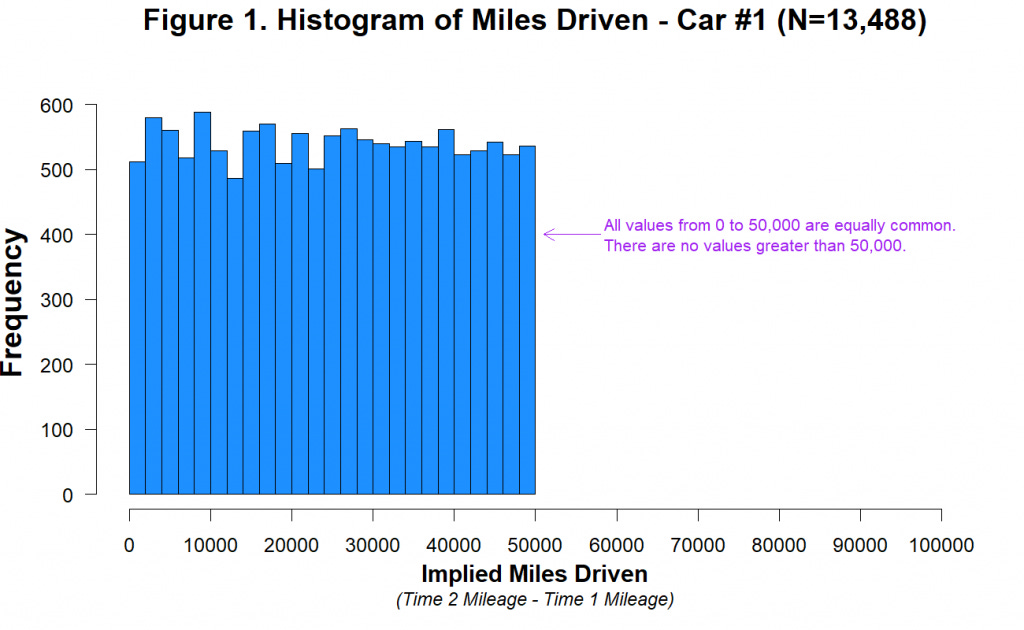
The participants in the study seemed to have a very uniform distribution of how much they drove their cars.
Almost as many people drove 20,000 miles as did 40,000 or 10,000 miles or 5,000 miles.
For a sample as large as 13,488, this is statistically improbable [p = 0.84]
Also, do you notice how the numbers just drop after 50,000 miles?
The people who exposed this fraud believe that it is because the data was generated using a random number generator with the ranges 0 - 50,000.
You can try this yourself on Excel with the RANDBETWEEN(0,50000) function.
Simply looking at this data distribution shows the data has been fabricated.
The Fallout
The original study was retracted soon after this data fabrication came to light but who exactly fabricated this data remains a mystery.
Ariely claims he made a mistake in not going deep enough into the data and denies any fabrication on his end. None of the authors seem to be involved in it either.
Who faked the data? We don’t know. We probably never will.
But the damage goes beyond that. People believe in a science only if the science is trustworthy.
Fabrication of data makes people lose that faith. It seems that data fabrication may be a lot more common than we think in the social sciences.
The problem is that not every paper can be scrutinized as well as this one was.
Then again, some fabricators may simply be too good at getting away with it. The fabricator for this paper was sloppy. Everyone won’t be.
How do we deal with that? We still don’t know. We don’t have clear answers but at least, we are now asking these questions.
The road to scientific integrity is long and arduous, but ultimately, it is one worth taking.
I got the data and the information for this article from the people over at Data Colada. You can read the original blog here.
I have seen this happen a lot during dissertation submissions of college students, where in order to finish up before the deadline they fake the data. Also, I have seen some people , do it, so that they get a significant 'difference or change' in the result, to point out that their study worked.
Good summary